Interactive Google Analytics Charting in R with Plot.ly
We will walk around creating an interactive line chart in R with Google Analytics data and publishing online at Plot.ly. If you haven’t setup Rstudio please read my previous post here. For the charting part, we will be using Plot.ly, so let’s start by installing the required libraries:
Install Plotly package.install.packages("plotly")
Then copy paste the code below:
## loading packages
library(googleAnalyticsR)
library(plotly)

##for refreshing token
ga_auth()

##Charting script ## Do replace with your profileid below
ga_data <- google_analytics_4("ga:634243597",
                              date_range = c("2016-11-01","2016-11-30"),
                              dimensions=c('date'),
                              metrics = c('sessions'),
                              order = order_type("date", "ASCENDING")
)

## Defining X and Y axis
Sessions <- c(ga_data$sessions)
Date <- c(ga_data$date)

## Draw chart
plot_ly(x = ~Date, y = ~Sessions, type = 'scatter', mode = 'lines')
Execute Script
Be sure to replace with your Google Analytics profileId. And we will get visualization like below.

Now, let’s publish the chart to Plot.ly by configuring API settings for this. Use the code below to setup:
## Plot.ly user name
Sys.setenv("plotly_username"="alenmjis")

## Plot.ly API key
Sys.setenv("plotly_api_key"="nEa6DAQJnwqfweO3qS8an")
You can generate API key here at settings.
Publishing ChartTo publish use:
p <- plot_ly(x = ~Date, y = ~Sessions, type = 'scatter', mode = 'lines')
plotly_POST(p, filename = "line-chart")
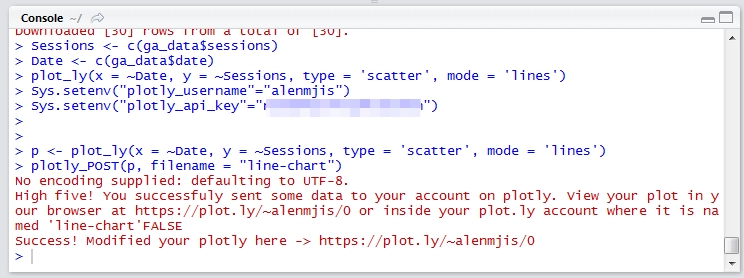
Below is the live embedded chart and link.