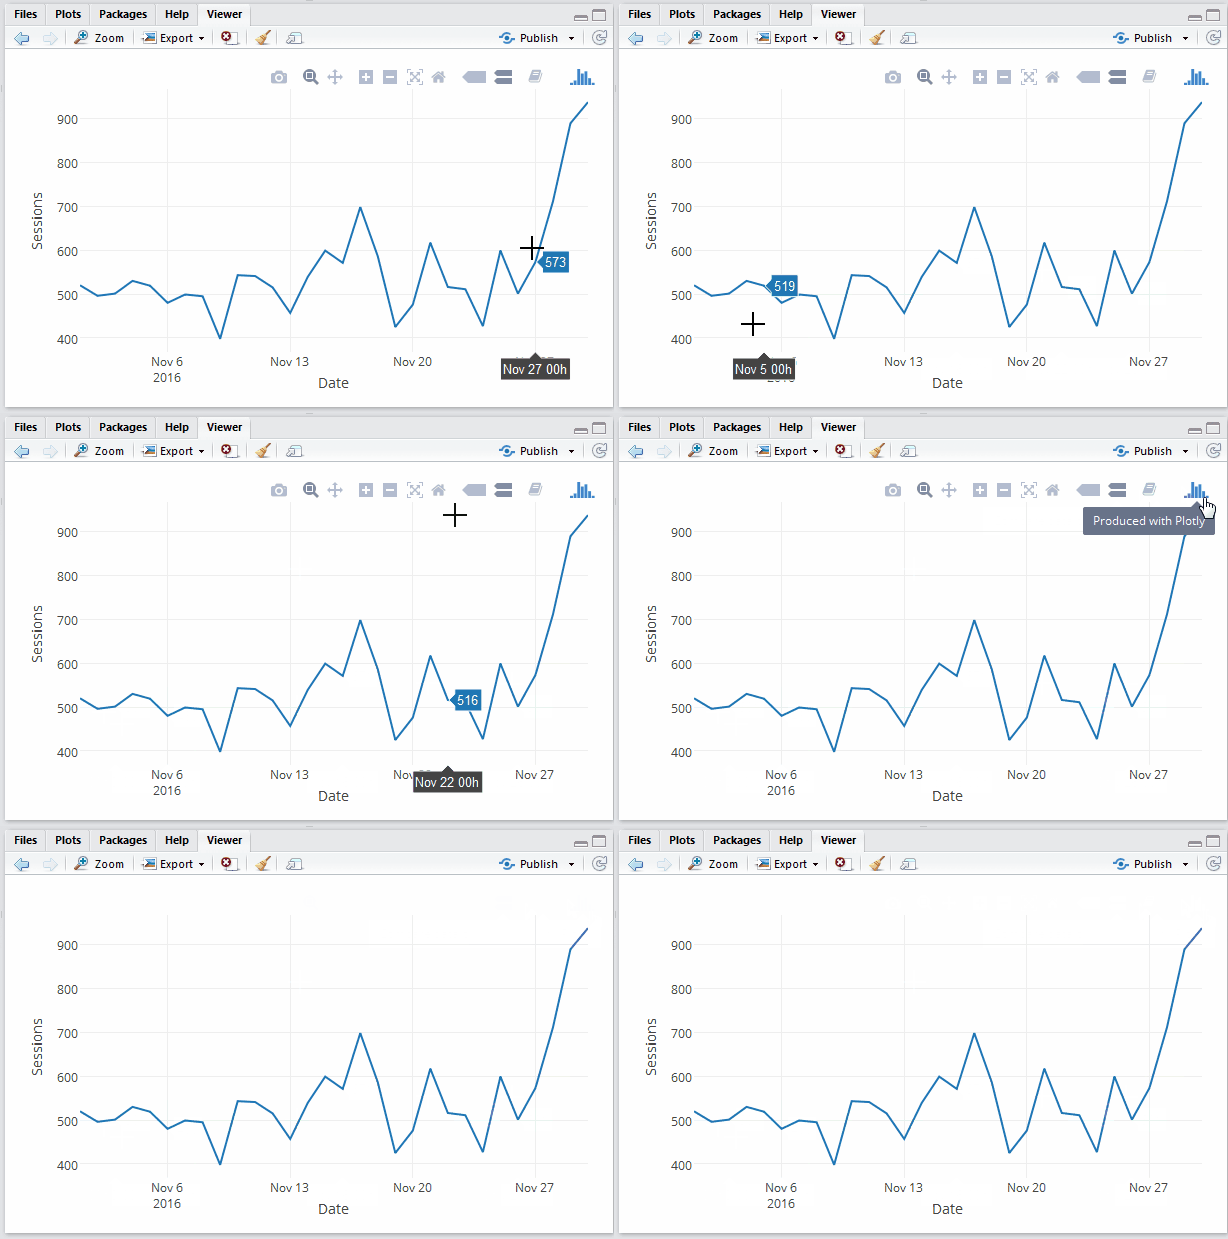
R is a great open-source tool for visualizing data and there are plenty of libraries for connecting Google analytics too. In this tutorial, I will be using RStudio IDE with googleAuthR and googleAnalyticsR packages.
Let’s start!
Step 1 – Install R
Step 2 – Install RStudio, the most commonly use IDE
