Interactive Google Analytics Charting in R with Plot.ly
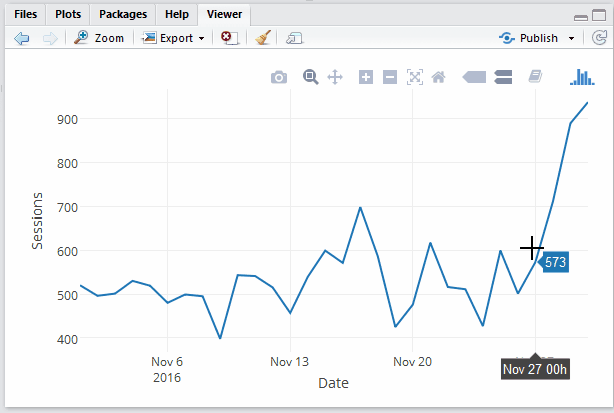
We will walk around creating an interactive line chart in R with Google Analytics data and publishing online at Plot.ly....
Showing 2 posts in the r category
We will walk around creating an interactive line chart in R with Google Analytics data and publishing online at Plot.ly....

R is a great open-source tool for visualizing data and there are plenty of libraries for connecting Google analytic...